Key reporting concepts in Kula Analytics
Last updated: August 16, 2026
Kula Analytics is where you go to answer questions about your hiring: how candidates are moving through your pipeline, how long each stage takes, and how your team is performing. Reports and analytics gives you two ways to see that data: a set of built-in reports covering the most common questions, and a custom report builder for questions the built-in reports don't answer.
A handful of concepts, metric, group by, breakdown, filter, and drilldown- show up the same way across every report in Kula. Once you understand them, you can read any built-in report, or assemble your own from scratch.
You'll find Reports and analytics from the main navigation. Built-in reports and custom reports live side by side there, and both use the concepts in this article.
Default reports and custom reports
Kula gives you two kinds of reports:
Default reports: prebuilt reports Kula ships with. Each one covers one part of your hiring process, and you can filter and group the data, but you can't change what it measures.
Custom reports: reports you build yourself, by adding metric cards, charts, and tables for the data you care about.
Kula's Default reports are:
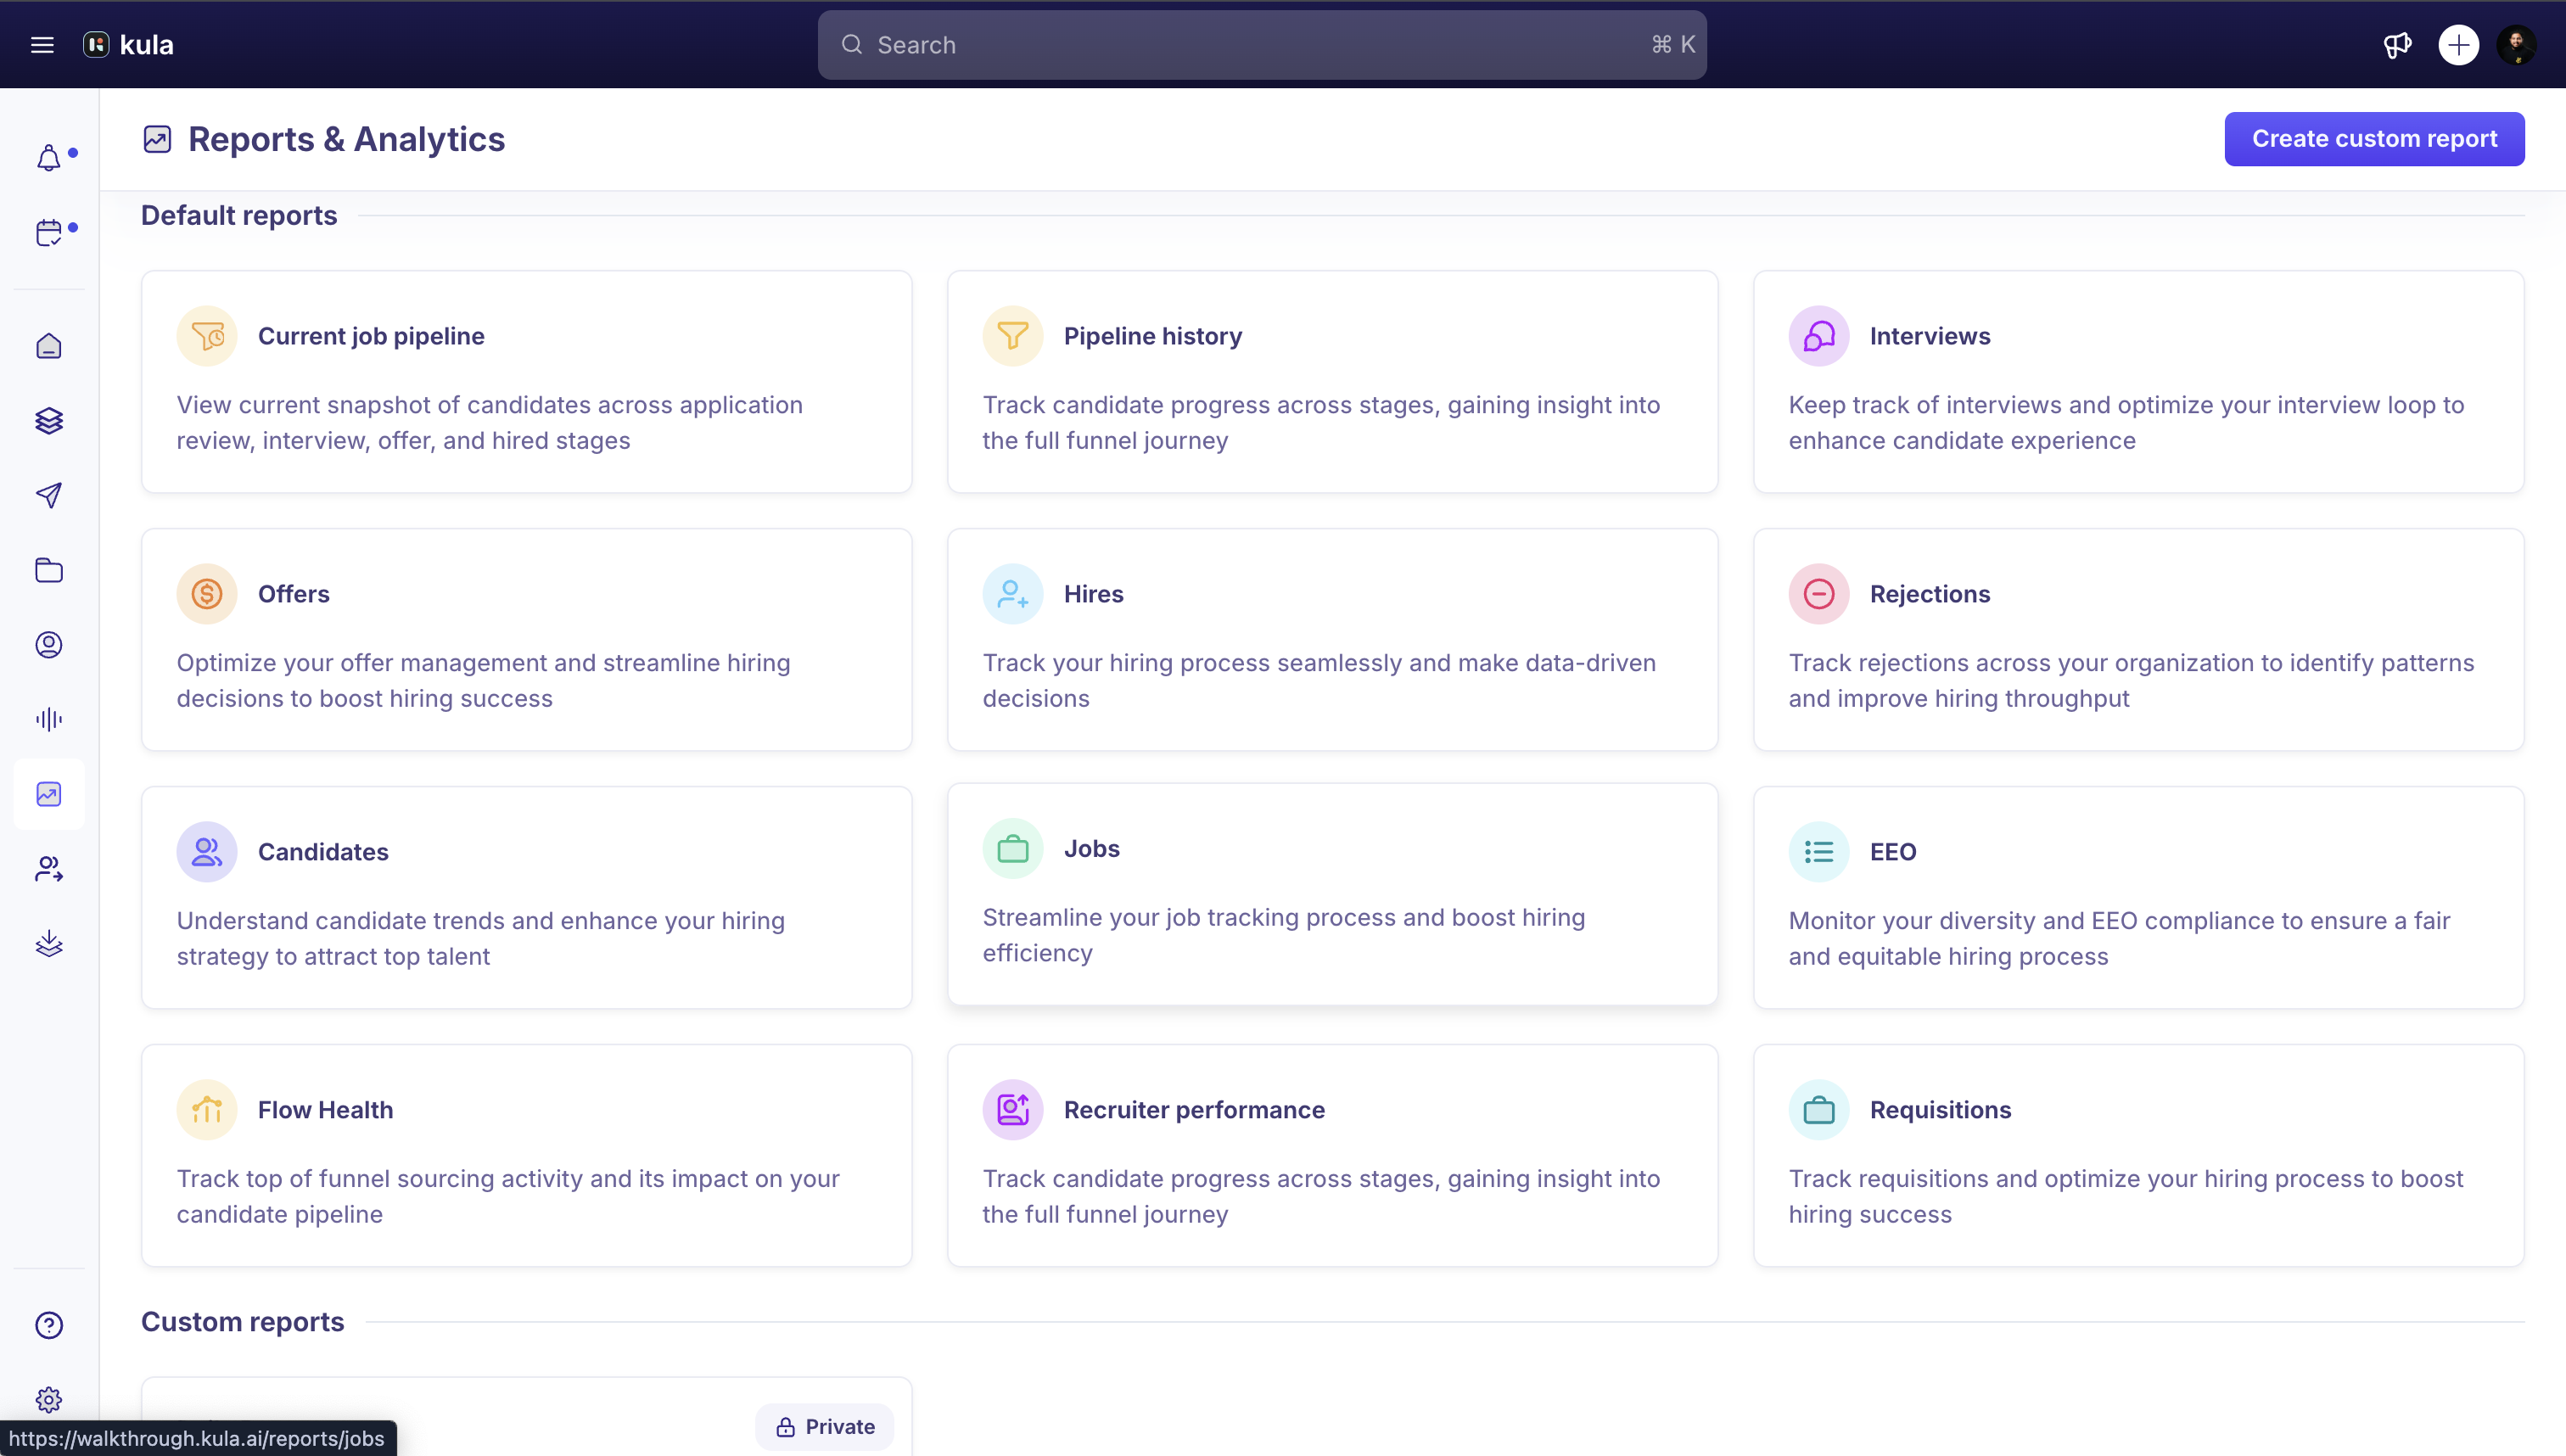
Current job pipeline: a live snapshot of candidates currently in application review, interview, offer, and hired stages.
Pipeline history: candidate progress across stages over time, for the full funnel journey.
Interviews: interview volume and scheduling, to help you optimize your interview loop.
Offers: offer activity and outcomes.
Hires: your hiring activity over time.
Rejections: rejection volume and patterns across your organization.
Candidates: candidate volume and trends.
Jobs: job-level activity across your open roles.
EEO: diversity and EEO compliance data.
Flow Health: top-of-funnel sourcing activity and its effect on your pipeline.
Recruiter performance: activity and outcomes by recruiter.
Requisitions: requisition activity and status.
A custom report is made up of tiles: metric cards, charts, or tables. When you add a tile, you pick it from a category that mirrors the static reports, such as Jobs, Pipeline, Hires, Interviews, Offers, Rejections, Candidates, EEO, Requisitions, Recruiter performance, or Flow Health, so a custom report can combine data from any of them on one page.
Metrics and what date they're based on
A metric is the number a card, chart, or table shows you, such as a count of hires or an average time to offer. Every metric is tied to a specific date field, and Kula uses that field, not some other date, to decide whether a record falls inside your selected date range.
For example, on the Recruiter performance report:
Sourced applications is based on the application's creation date.
Screened applications is based on the date the application moved out of the application review stage.
Hired is based on the hired date.
Rejected is based on the rejection date.
Avg. time to hire is based on the hired date.
Offer acceptance rate is based on the offer acceptance date.
Note: Because metrics are dated differently, two metrics in the same report can be counting activity from different moments. Check what a metric is based on before comparing it against another one.
Group by and breakdown
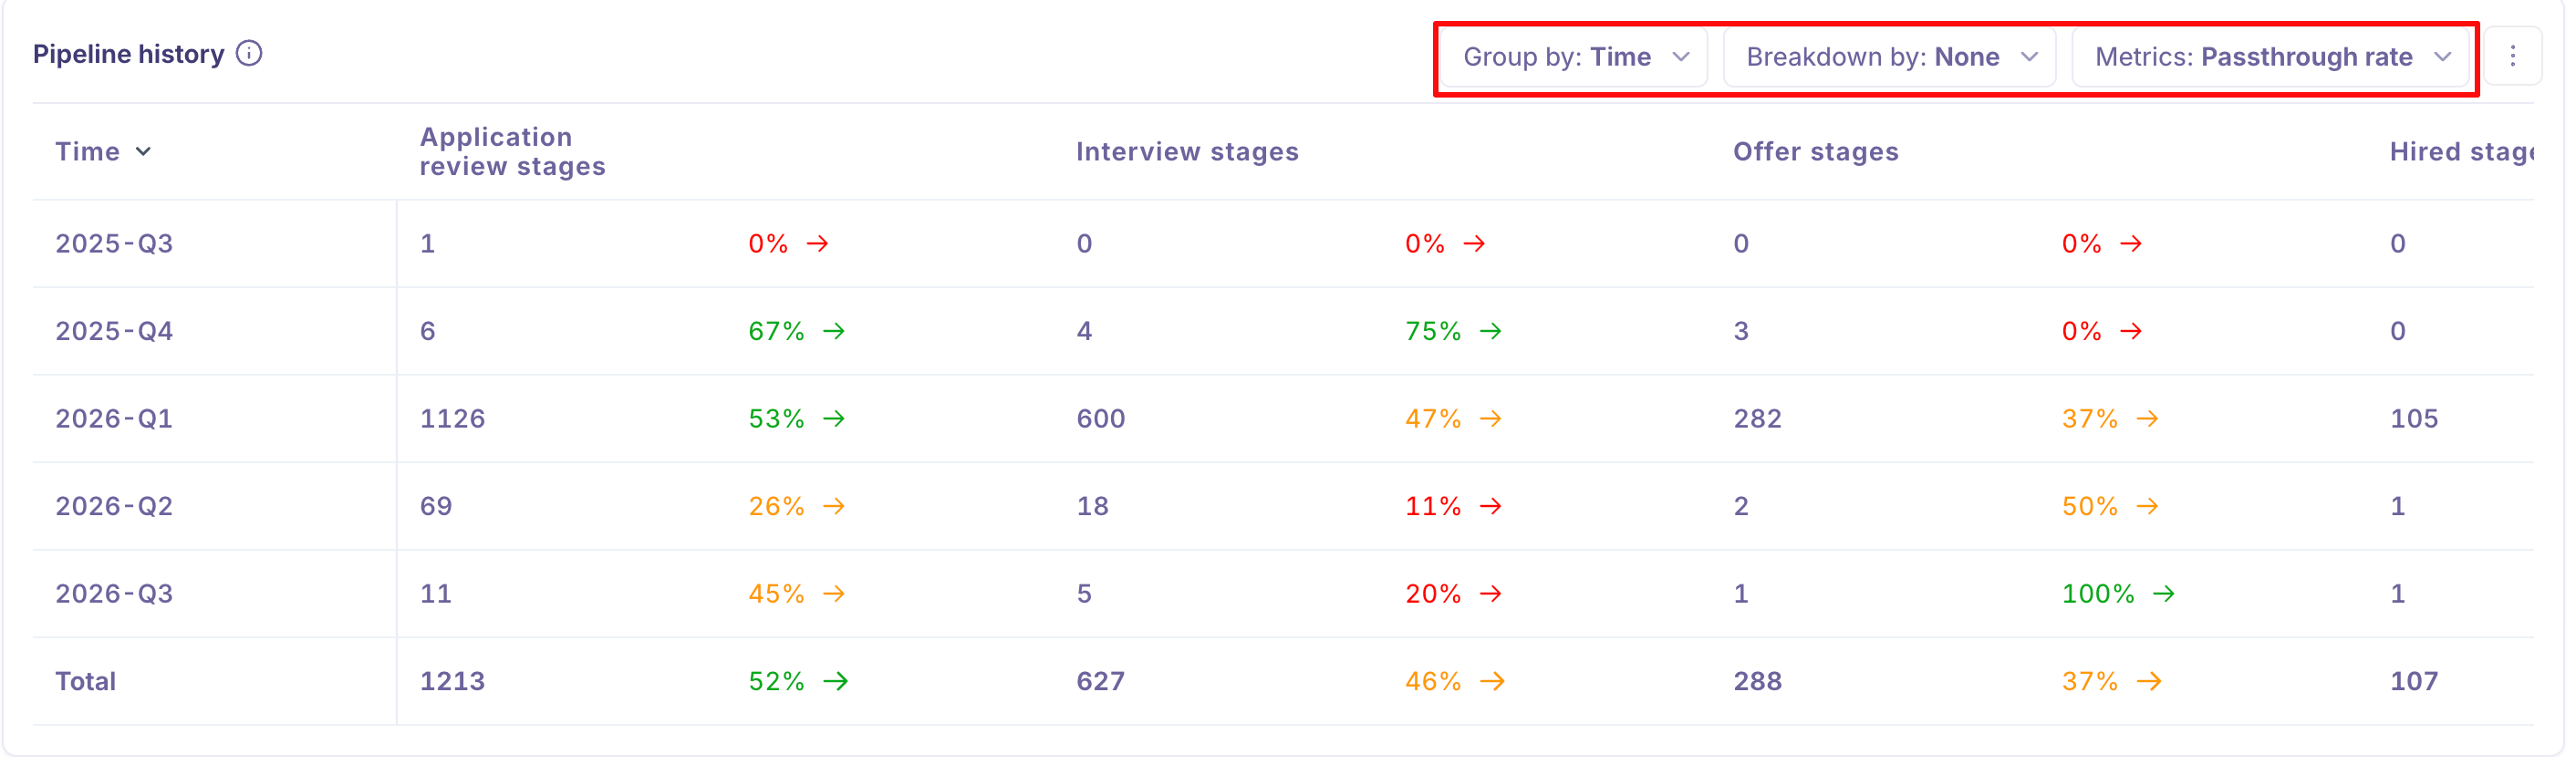
Group by sets the primary way Kula splits your data into rows or segments, for example one row per job, or one row per recruiter. Breakdown adds a second, finer split within each group, for example splitting each job's row further by application source. A breakdown is optional. Leave it set to None to see each group as a single row.
Group by and breakdown draw from the same kinds of fields, organized by where the field lives:
Job-level fields: job title, job status, department, subdepartment, office, hiring manager, recruiter on the job, and (with some ATS integrations) sourcer or suboffice.
Application-level fields: source, rejection reason, and (with some ATS integrations) source type or rejection type.
Candidate-level fields: gender and recruiter on the candidate.
Filters
Filters narrow a report down to a specific slice of your data before Kula calculates anything. Common filters include:
Job name, job type, and job status
Department and office
Primary recruiter and primary hiring manager
Users (any Kula user associated with a record)
Custom reports also let you filter by survey name for survey-based data.
Each filter also has a condition: Include any to keep records matching any of your selected values, or Exclude all to remove records matching any of them.
Date range and comparing periods
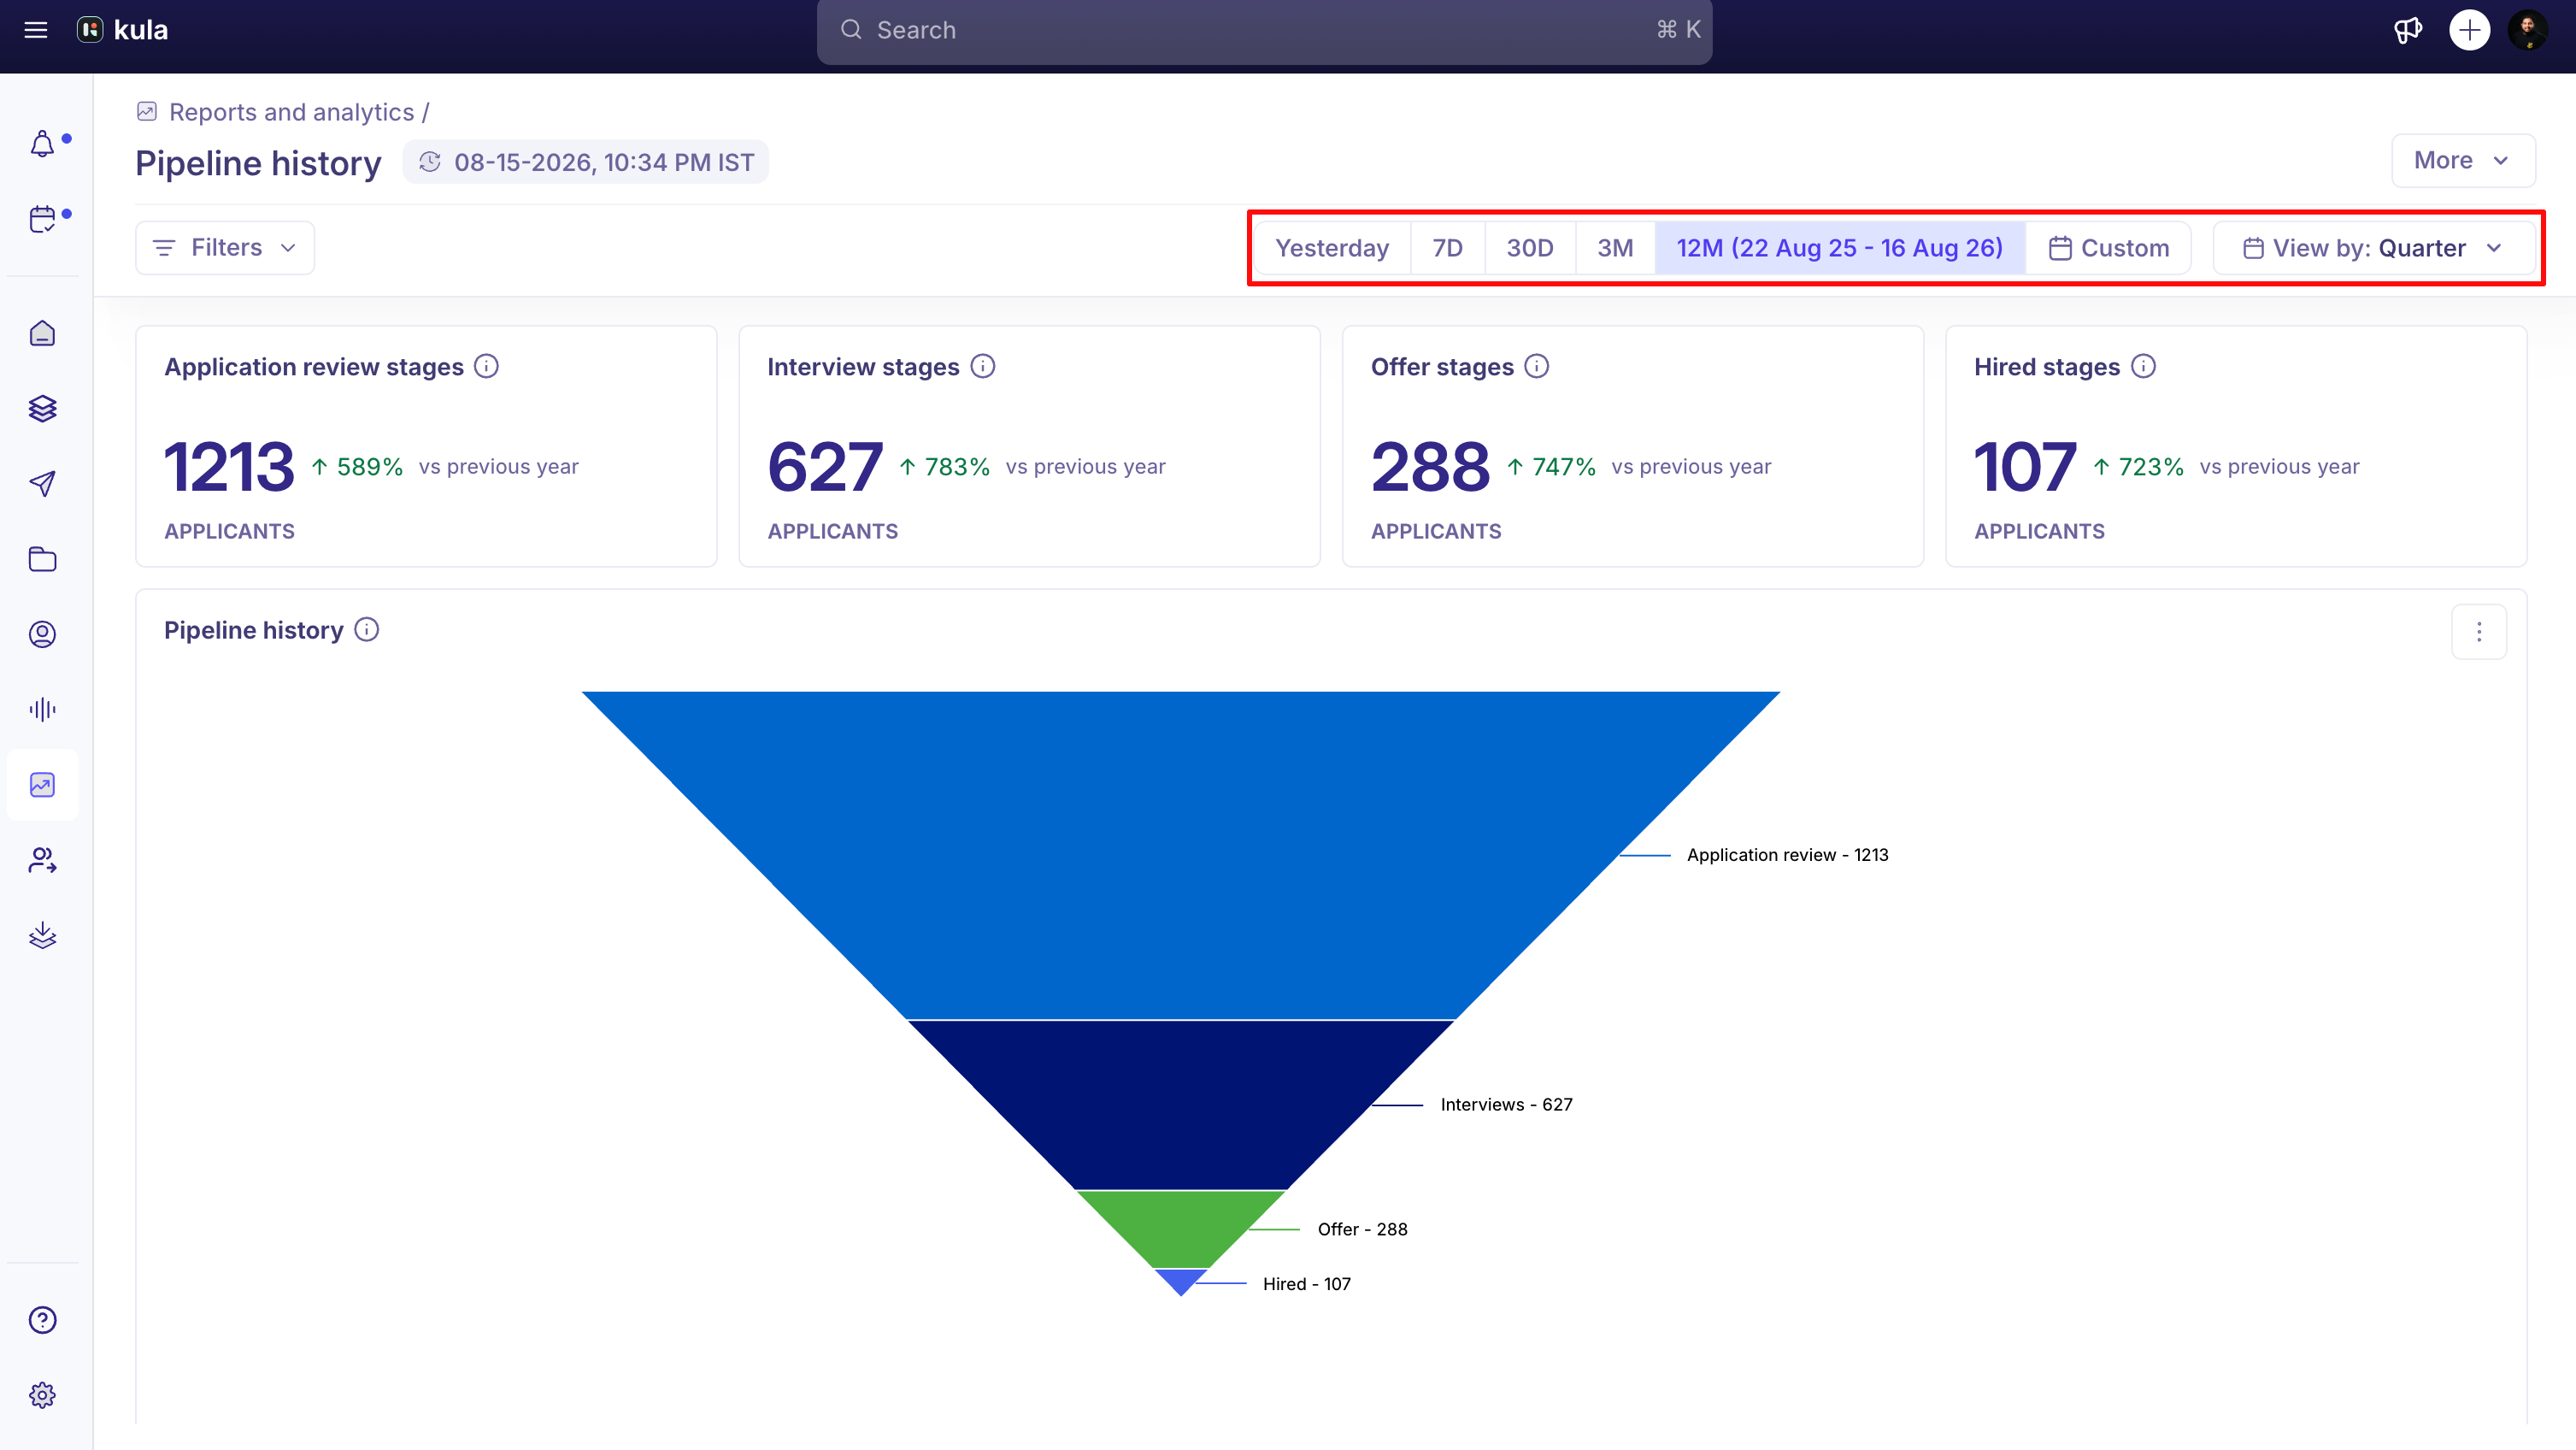
Every report runs against a date range, called the timeframe. Choose a preset, Today, Yesterday, 7D, 30D, 3M, or 12M, or set a custom range.
You can also compare your selected timeframe against an earlier period of the same length, so a card or chart shows both the current number and how it changed.
Choosing a time bucket
For reports and tiles that show data over time, View by controls how Kula buckets your date range: Day, Week, Month, Quarter, or Year. The buckets available depend on how wide your date range is:
Day is available for ranges up to 31 days.
Week is available for ranges up to 91 days.
Month is available for ranges up to 366 days.
Quarter and Year are available for any range.
Drilldown
Any underlined number in a report, in a card, a chart, or a table, is clickable. Click it to open a drilldown: a list of exactly which candidates or applications make up that number, without leaving the report. The drilldown keeps your report's filters, group by, and breakdown, and shows a running count of how many records you're looking at.
Custom reports
Custom reports let you build exactly the view you need by combining report blocks from across Kula's default reports. You choose the name, the blocks, the default filters, and who can see it.
When to use a custom report:
You want to combine metrics from different default reports into a single view (e.g. pipeline health + recruiter performance side by side).
You need a report tailored to a specific team, department, or hiring campaign.
You want to save a filtered view so you don't have to set it up every time.
You're building a report to share with a hiring manager or leadership that focuses only on what's relevant to them.
Sharing and managing a report
Each report has a visibility setting: Only me, Selected users, or Everyone. If you choose Selected users, add specific teammates as viewers or editors from the report's sharing menu.
From a report's menu, you can also:
Clone report to start a new report from an existing one.
Download as PDF to export the report as it currently looks.
Schedule email to have Kula email the report to chosen recipients on a recurring basis.
Delete report to remove a custom report you no longer need.
Need help?
If you have questions or need assistance, reach out to us at or use the in-app chat