Rejections Report
Last updated: September 23, 2026
Rejections are a critical yet often overlooked aspect of the recruitment process. Understanding why candidates are rejected and how often rejections occur can provide invaluable insights into your hiring practices and help identify areas for improvement. The Rejections report in Kula gives you a detailed analysis of rejection patterns, enabling you to refine your recruitment strategy, reduce time-to-hire, and enhance the candidate experience.
Who can do this: Anyone with the View all default reports permission. Admin and Super Admin have it by default; other roles can be given it in Settings → Roles and permissions.
Where to find it: Reports and Analytics in the left-hand navigation → Rejections.
Key Metrics:

Rejected Applicants: This metric tracks the total number of candidates rejected within the selected timeframe, offering a clear picture of rejection trends in your hiring process.
Time to Reject: This metric calculates the average time taken from a candidate's application submission to their rejection. Understanding this timeline is crucial for evaluating the efficiency of your screening process and identifying potential bottlenecks.
Key Visualisations:
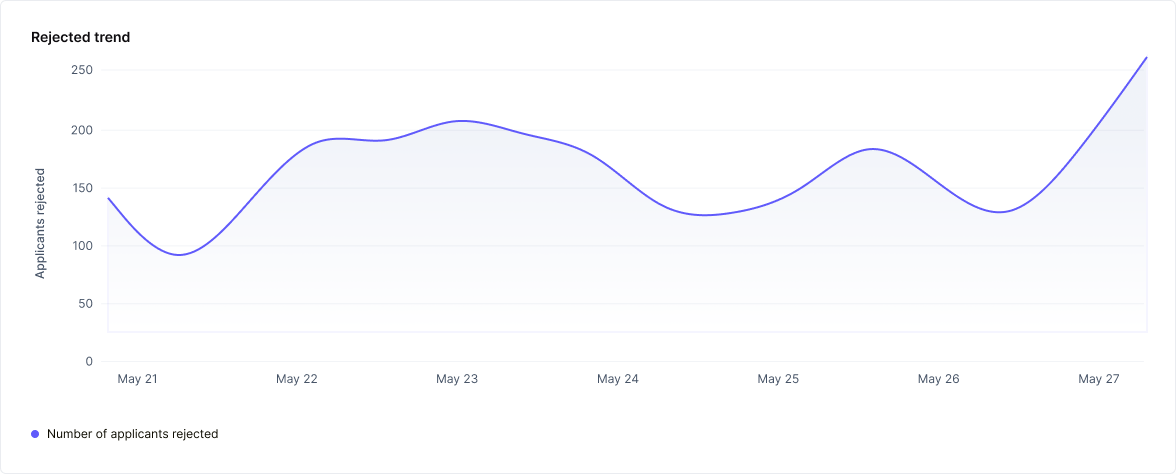
Rejected Trend: A line trend chart that displays the number of rejections over time, allowing you to identify patterns and understand how rejection rates fluctuate during different periods.
Rejected Reasons (We Rejected Them): A pie chart that categorizes the reasons your organization decided to reject candidates. This visualization helps you analyze the most common reasons for rejections, enabling you to refine your screening criteria.
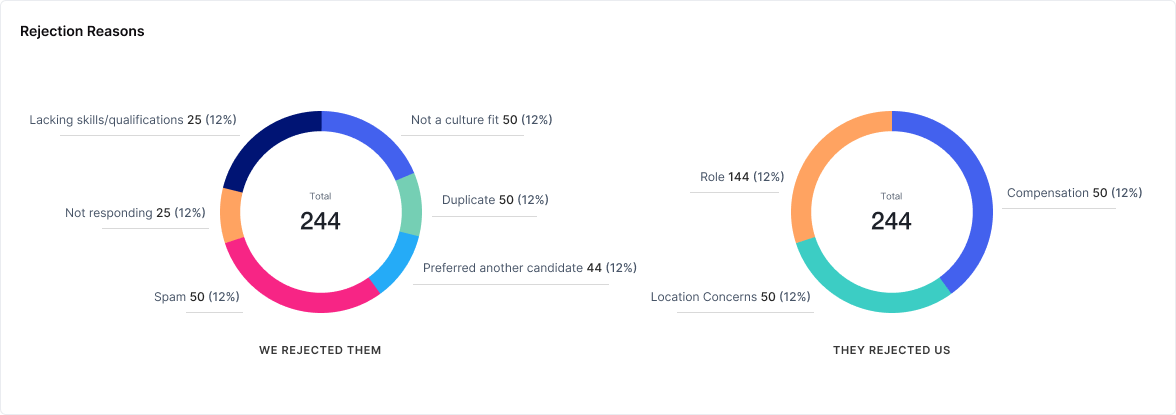
Rejected Reasons (They Rejected Us): Another pie chart that shows why candidates chose to reject your offers. This data is vital for understanding candidate expectations and improving your offer acceptance rates.
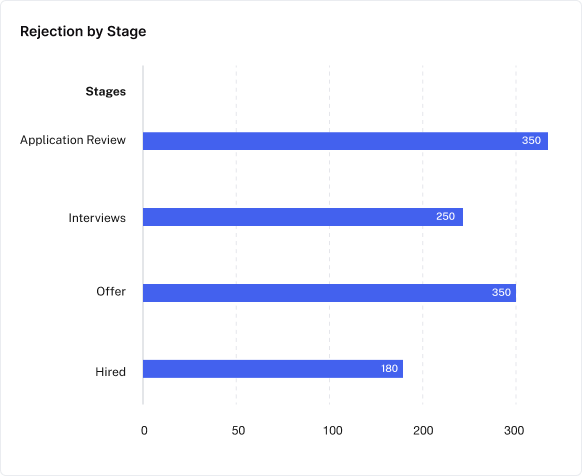
Rejection by Stage: A bar chart that breaks down rejections by the stage of the recruitment process where they occurred. This visualization highlights potential drop-off points and helps you identify stages where candidates are more likely to be rejected.
Rejection by Source (On Application): A bar chart that categorizes rejections based on the source of the application, giving you insights into which recruitment channels may be yielding lower-quality candidates or facing higher rejection rates.
Filter the report
Click Filters to narrow the report with any of these:
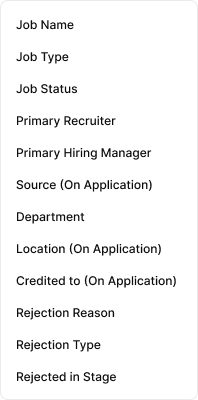
Job Name: Filter the data by specific job titles to analyze rejection metrics for particular roles.
Job Type: Customize the report based on different employment types (e.g., full-time) to see how rejection rates vary across job categories.
Job Status: Focus on rejections within open, closed, etc. job postings to understand how rejection patterns correlate with job status.
Department: Analyze rejections by department to identify which areas of your organization experience higher rejection rates and why.
Primary Recruiter: Filter the data by recruiter to assess their impact on candidate rejection and identify opportunities for improving recruiter performance.
Primary Hiring Manager: Customize the report based on the hiring manager responsible for the rejection decision, providing insights into their decision-making process.
Source (On Application): Examine rejection data based on the source of the application to understand which recruitment channels contribute to higher rejection rates.
Location (On Application): Filter by the geographic location of the job application to assess regional differences in rejection patterns.
Credited To (On Application): Analyze rejections based on the individual or team credited with the application to understand how different stakeholders impact rejection outcomes.
Rejection Reason: Customize the report to focus on specific rejection reasons, helping you pinpoint common issues and adjust your recruitment strategy accordingly.
Rejection Type: Filter by whether the rejection was initiated by your organization or by the candidate, providing a clearer understanding of who is driving the rejection decisions.
Rejected in Stage: Analyze where in the recruitment process rejections are most likely to occur, helping you identify stages that may need refinement to reduce candidate drop-off.
Rejection breakdown
The Rejection breakdown table breaks your rejection data down by the dimensions you choose.
Group By lets you categorize your rejection data by various key dimensions, enabling you to analyze trends and pinpoint specific areas for improvement.
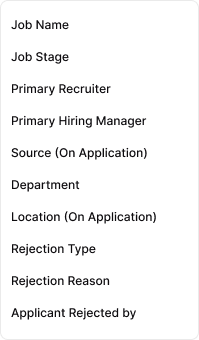
Time: The default. Shows rejections period by period across your timeframe.
Job Name: Organize rejection data by specific job titles to understand how different roles are impacted by rejection rates, helping you identify any problematic positions.
Job Stage: Group rejections by the stage of the recruitment process, such as initial screening, interview, or final offer, to see where candidates are most often eliminated.
Primary Recruiter: Categorize rejections by the recruiter responsible for managing the candidate, allowing you to assess recruiter effectiveness and identify any need for training or process adjustments.
Primary Hiring Manager: Group data by the hiring manager involved in the rejection decision to gain insights into their decision-making and its impact on rejection rates.
Department: Analyze rejections by department to understand how different areas within your organization handle candidate selection and where rejections are more frequent.
Source (On Application): Group rejections by the source of the job application to evaluate the effectiveness of various recruitment channels and identify those that may require optimization.
Rejection Type: Categorize rejections by whether they were initiated by your organization or by the candidate, helping you differentiate between internal and external factors influencing rejections.
Rejection Reason: Group data by specific rejection reasons, allowing you to identify the most common reasons for rejecting candidates and address potential issues in your hiring criteria.
Applicant Rejected By: Organize data by the individual or team responsible for rejecting the applicant, providing clarity on who is making rejection decisions and their impact on your recruitment process.
Rejected by: Separate rejections made by a person from those made by an auto-rejection rule.
The "Breakdown By" filter adds a secondary layer of detail to your grouped data, enabling more granular analysis and helping you uncover deeper insights.
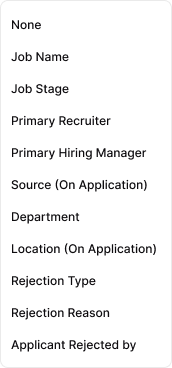
None: View the grouped data without any additional breakdown, focusing solely on the primary "Group By" category for a broad overview.
Job Name: Add a breakdown by job title to see variations within each group, helping you understand how specific roles are affected by rejection patterns.
Job Stage: Further refine your analysis by differentiating between stages within the recruitment process, offering insights into where candidates are most frequently rejected.
Primary Recruiter: Break down the data by recruiter within each group to assess individual recruiter performance and their influence on rejection outcomes.
Primary Hiring Manager: Add a breakdown by hiring manager to evaluate their decision-making process and its impact on rejection rates within the selected group.
Department: Further analyze rejection data by department to get a detailed view of how different areas of your organization contribute to candidate rejections.
Source (On Application): Break down the data by the source of the application within each group, helping you evaluate the effectiveness of different recruitment channels.
Rejection Type: Add a breakdown by rejection type to differentiate between internally and externally driven rejections within each group.
Rejection Reason: Break down the data by specific rejection reasons within the selected group, providing a clearer picture of the most common causes for rejecting candidates.
Applicant Rejected By: Further refine the data by the individual or team responsible for the rejection decision, offering insights into their impact on rejection patterns.
Rejected by: Split each group into rejections made by a person and those made by an auto-rejection rule.
Choose a timeframe
Pick the period the report covers:

Yesterday: Get a quick snapshot of rejection activity from the previous day, helping you stay on top of recent developments in your hiring process.
Last 7 Days: Analyze rejections over the past week to identify short-term trends and evaluate the immediate impact of your recruitment strategies.
Last 30 Days: Review the past month’s rejection data to gain insights into monthly trends, helping you understand the effectiveness of your hiring practices over a longer period of time.
Last 3 Months: Examine rejection patterns from the past quarter, offering a broader perspective on how your recruitment process is performing over time.
Last 12 Months: Look at rejection data from the past year to identify annual trends, seasonal fluctuations, and long-term patterns that could influence your recruitment strategy.
Custom: Define a specific timeframe that suits your unique needs. Whether you want to focus on a particular project, hiring campaign, or custom period, this option allows you to tailor the data to your exact requirements.
Download or schedule the report
Share the report as a PDF, or have it emailed on a schedule.
Download as PDF: To create a portable, shareable version of your rejection report, simply click on the "More" button located in the top right corner of the screen. From the drop-down menu, select the "Download as PDF" option. This will generate a well-formatted PDF document that you can easily distribute to stakeholders, save for future reference, or review offline.
Schedule Email: To keep your team updated with regular reports, use the "Schedule email" feature. This feature allows you to set specific times and frequencies for the report to be sent to designated stakeholders and ensures that everyone stays up-to-date with the latest offer metrics without manual effort.
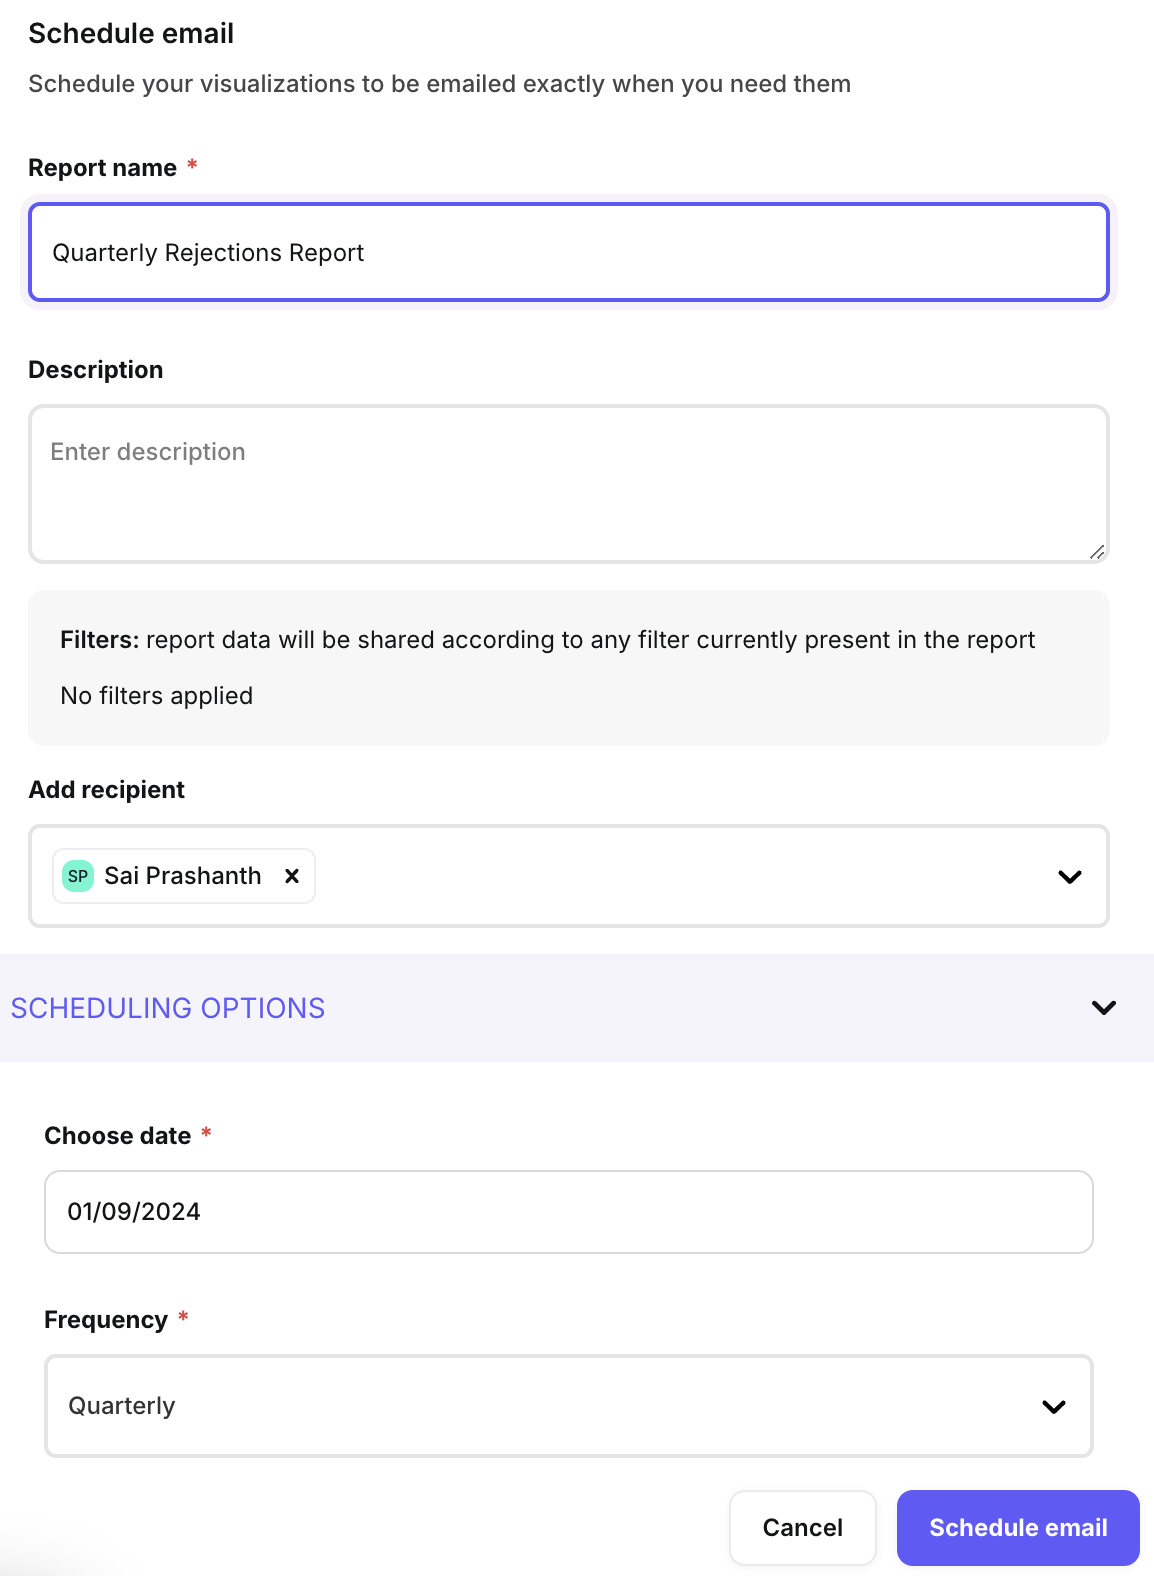
These features streamline the process of sharing rejection data, making it easier to maintain transparency, track trends, and adjust your recruitment strategies as needed.
Good to know
Rejection type tells you who ended it. The We Rejected Them and They Rejected Us charts, and the Rejection Type filter and grouping, separate rejections your team made from candidates who pulled out.
Auto-rejections are counted too. Group or break down by Rejected by to separate rejections a person made from those made by an auto-rejection rule.
Download as PDF is under More. Click More in the top right corner of the report.
FAQ
Can I see which rejections came from auto-rejection rules?
Yes. Set Group By or Breakdown By to Rejected by. How do I send this report to my team regularly?
Use Schedule email to choose when it's sent and who gets it. Can I see only one job's rejections?
Yes. Click Filters and choose the job under Job Name.
Need help?
If you have questions or need assistance, reach out to us at support@kula.ai or use the in-app chat.